
Console Viewer Documentation
What is Console Viewer?
Console Viewer captures Blender's Python output and displays it inside Blender's own interface, so you don't need a separate console window open while you work. On Linux and macOS, where Blender has no Toggle System Console menu entry, it is often the only way to see that output without restarting from a terminal.
Installation
Installing the Addon
Requirements: Blender 4.2 or newer.
The installation process is straightforward and identical across all operating systems:
- Download the addon ZIP file from your order page.
- Open Blender and navigate to Edit › Preferences › Add-ons or Get Extensions (It's the same dialog).
- Click the Install button in the top-right corner.
- Select the downloaded ZIP file and click Install Add-on.
- Enable the addon by checking the box next to "Console Viewer".
- The addon panel will appear in the 3D Viewport sidebar (press N) under the "Console" tab. It can also be shown in the Text Editor sidebar (see Panel Location below).
Important: After enabling the addon, you must go to the addon preferences and toggle Enable Console Capture to start capturing output. The addon is designed to not capture by default, so that installing it never replaces Blender's output streams without an explicit action on your part. You don't have to hunt for that toggle: while capture is off, the panel itself shows an Open Add-on Preferences button that takes you straight there.
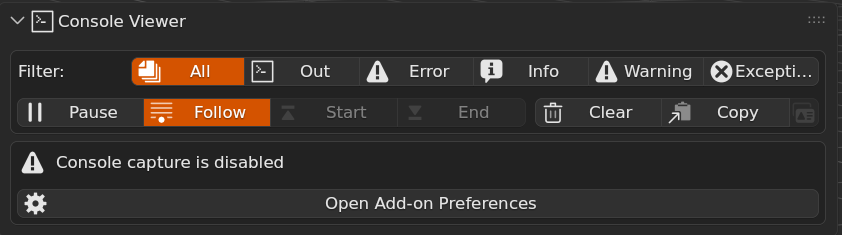
Configuring Preferences
After installation, configure the addon's preferences for your workflow:
- Open Edit › Preferences › Add-ons.
- Find Console Viewer in the list and expand its preferences panel.
- Configure the available options as needed.
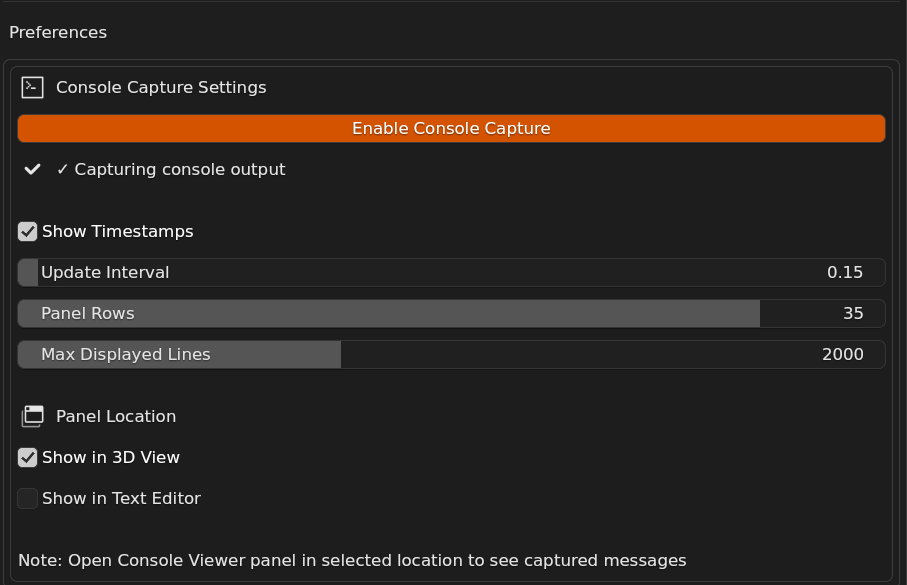
Enable Console Capture
This is the master toggle for the capture system. When enabled, Console Viewer intercepts stdout, stderr, Python logging, warnings, and uncaught exceptions. The original output is preserved, everything still reaches the system console as well.
Why it's disabled by default: turning capture on replaces process-wide Python streams and hooks. That is a deliberate action, not something an addon should do to your Blender session just because it was installed. Keeping it off by default also guarantees zero overhead when you're not using the addon.
Show Timestamps
Displays the time each message was captured in HH:MM:SS format. Useful for tracking the sequence of events during debugging or identifying slow operations.
Timestamps appear on the first line of each message; continuation lines of a multi-line message are left bare, so wrapped output still reads as one block.
Update Interval
Controls how often the panel refreshes to show new messages. Values range from 0.1 to 2.0 seconds. Default: 0.15.
- Lower values (0.1–0.3): more responsive, good for real-time debugging.
- Higher values (1.0–2.0): fewer refreshes, good for long-running operations that produce a lot of output.
Panel Rows
The height of the console list, measured in rows (5–40). Default: 12.
This sets how much vertical space the list occupies in the sidebar. The list has its own scrollbar, so a smaller value doesn't limit how much output you can review, only how much is visible at once.
Max Displayed Lines
How many lines the list keeps on screen (200–5000). Default: 2000.
As new output arrives, the oldest lines are dropped from the list. This is a display limit only: the internal buffer still holds its full history, so Copy always exports everything.
- Lower values (200–500): lightest on memory, good for very high-volume output.
- Higher values (2000–5000): more visible history to scroll back through.
Panel Location
Two independent toggles decide where the panel appears:
- Show in 3D View: 3D Viewport sidebar (enabled by default).
- Show in Text Editor: Text Editor sidebar (disabled by default).
You can enable both, or neither if you want the addon capturing quietly in the background.
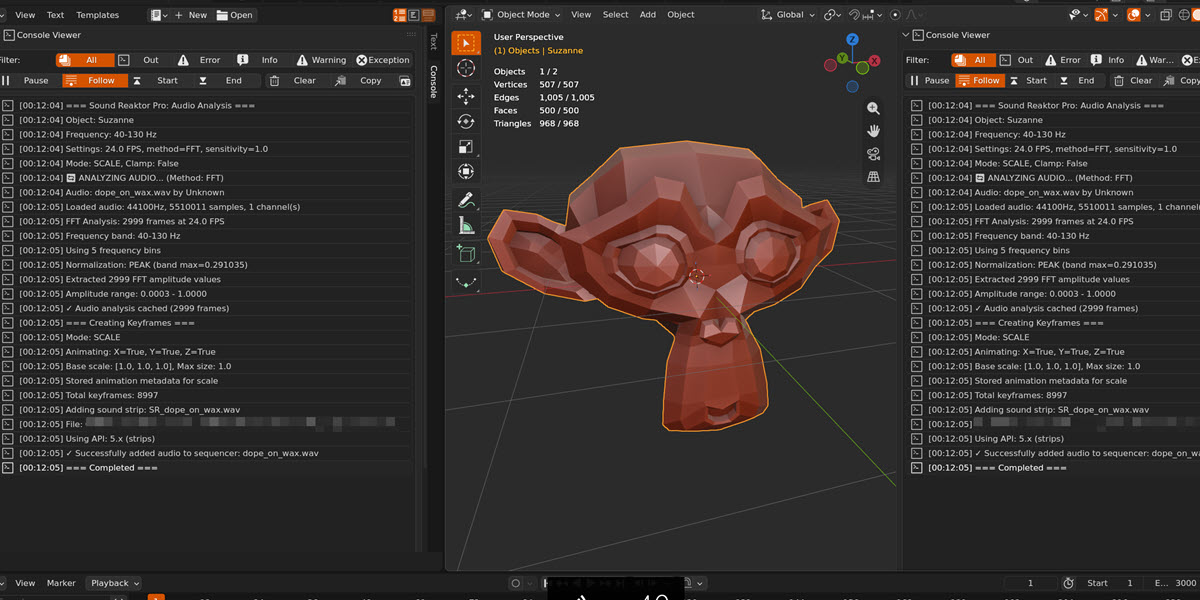
Interface Reference
Press N to open the sidebar in the 3D Viewport or Text Editor, then look for the "Console" tab.
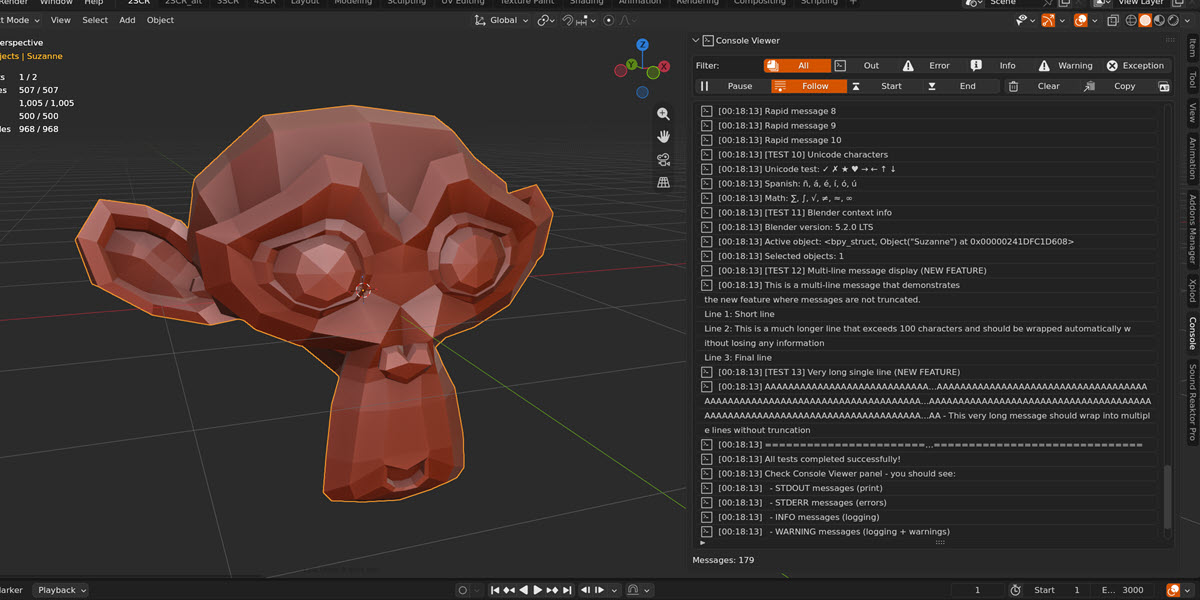
Filter Buttons
The top row of buttons controls which message types are displayed:
| Filter | Description |
|---|---|
| All | Shows all message types together. |
| Out | Shows only standard output (print statements). |
| Error | Shows only stderr output (error messages). |
| Info | Shows only info-level messages from Python logging. |
| Warning | Shows warnings from the logging and warnings modules. |
| Exception | Shows uncaught exception tracebacks. |
Changing the filter rebuilds the list immediately. Filtering never discards anything and switching back to All brings everything into view again.
Control Buttons
Pause / Resume
Toggles capture on and off without losing existing messages. When paused:
- New messages are discarded (not stored in the buffer).
- Existing messages remain visible and scrollable.
Note: Due to threading, messages already "in flight" when you click Pause may still appear. This is expected behaviour.
Pause is a lightweight switch, press it as often as you like. It differs from Enable Console Capture in preferences, which fully installs or removes the capture machinery and is meant to be toggled rarely.
Follow
Keeps the view pinned to the newest line, so incoming output stays visible without any scrolling on your part.
Follow turns itself off the moment you click a line in the list. That is deliberate: while you're reading older output, new messages shouldn't yank the view away from what you're looking at. Press Follow again, or End, to resume.
Start / End
Jump to the oldest or newest line currently in the list.
- Start moves to the top and stops following.
- End moves to the bottom and re-enables Follow.
Both are greyed out while the list is empty.
Clear
Removes all messages from the buffer and empties the list. This is permanent, cleared messages cannot be recovered.
Copy
Copies all buffered messages, with timestamps, to the system clipboard. Useful for sharing logs or saving a debug session to a file.
Because it reads the buffer rather than the visible list, Copy exports the full history even if older lines have scrolled out of the display.
Copy Line
Message Display
Messages appear in a scrollable list with the following elements:
- Icon: indicates the message type (output, error, warning, exception…).
- Timestamp (optional): time in
HH:MM:SSwhen the message was captured. - Message content: the actual text output.
Long messages are wrapped across several rows; only the first row carries the icon and timestamp, so a wrapped message still reads as a single block. Blank lines are omitted, which keeps print() output compact.
Very long messages (over 10,000 characters) are automatically truncated with a notice.
Captured Output Types
Console Viewer captures multiple types of Python output. It captures Python output specifically. See What Console Viewer Cannot Capture at the end of this section for where that boundary lies.
Print Statements
Standard print() calls are captured and displayed:
print("Debug: Operation started")
print(f"Processing {len(items)} items")
Python Logging Module
Messages sent through Python's logging module are captured at all levels:
import logging
logger = logging.getLogger(__name__)

logger.debug("Debug message")
logger.info("Info message")
logger.warning("Warning message")
logger.error("Error message")
Warnings Module
Python warnings are captured:
import warnings
warnings.warn("This feature is deprecated", DeprecationWarning)
Exceptions
Uncaught exceptions are automatically captured with their full traceback:
try:
    risky_operation()
except Exception as e:
    print(f"Error: {e}")   # Captured as stdout
    # Uncaught exceptions are also captured automatically
Progress Bars
Console Viewer supports carriage return (\r) for progress indicators:
for i in range(100):
    print(f"\rProgress: {i}%", end='')
# Updates the same line in Console Viewer
What Console Viewer Cannot Capture
Console Viewer captures Python output. Some messages reach Blender's system console through paths that never touch Python's output streams, and those cannot be captured. This is a deliberate boundary of the addon's design, not a defect. Knowing where it lies will save you time when a message you expected doesn't show up.
Blender's own C/C++ output. Blender's core is written in C and C++, and writes directly to the process output, bypassing the Python interpreter entirely. This includes startup and GPU/driver messages, render and compositor progress from Cycles and EEVEE, and Error: lines raised by built-in operators.
self.report() calls from other addons. This one is easy to miss, because the addon producing the message is written in Python. When an operator calls self.report({'INFO'}, "…"), the message doesn't go through print(); it goes into Blender's report system, which displays it in the status bar and the Info Editor, and prints it to the system console from the C side. Console Viewer never sees it.
Exceptions Blender catches internally. If an operator raises an exception, Blender catches it internally and prints the traceback itself. Console Viewer captures exceptions that reach Python's top-level handler, which in practice means uncaught exceptions from scripts and timers rather than from operators. Exceptions you catch and print() yourself are always captured.
Output from external processes. Anything a script launches through subprocess writes to its own output, not to Python's streams. To capture it, have your script read the process output and print() it.
Output from native libraries. Python modules with compiled C extensions may write from native code, which bypasses sys.stdout the same way Blender's core does.
Rule of thumb: if the message comes from print(), the logging module, the warnings module, or a traceback produced by Python code, Console Viewer captures it. If it comes from anywhere else, use Blender's System Console.
Running Without a Console
Console Viewer doesn't read the console. It replaces Python's sys.stdout inside Blender's process. What sits on the other end (a terminal, a discarded stream, or nothing at all) doesn't affect capture.
- Launched from a terminal (typical on Linux): output appears both in the terminal and in the panel.
- Launched from a desktop shortcut, the Finder or the Dock: Blender has no terminal attached and Python's output is discarded by the system. The panel still shows everything.
That second case is where the addon earns its keep. Linux and macOS have no Toggle System Console menu entry, Blender's Windows-only equivalent, so once the application is running there is no way to bring the output back.
The alternative is to quit Blender and relaunch it from a terminal, which does show the output but means interrupting whatever you were doing and keeping a second window in view for the rest of the session. Console Viewer puts the same output inside the interface you're already working in, available at any time and without restarting.
Troubleshooting
Panel is Empty
Symptom: The Console Viewer panel shows no messages.
Solutions:
- Check that Enable Console Capture is toggled ON in addon preferences. If it isn't, the panel shows an Open Add-on Preferences button instead of a list.
- Click Resume if capture is paused.
- Verify you're generating Python output (try
print("test")in the Python console). - Check the filter. You may be filtering out the message type you're looking for.
Not Seeing Expected Messages
Symptom: Some messages appear in the system console but not in Console Viewer.
Causes and solutions:
- The message isn't Python output. Blender's own C/C++ messages, other addons'
self.report()calls, and output from external processes never reach Python's output streams, so they cannot be captured. See What Console Viewer Cannot Capture for the full list. This is the most common reason by far. - Wrong filter: switch to All to see every message type.
- Display limit: the list keeps the most recent Max Displayed Lines. Older lines leave the list but remain in the buffer, so Copy still exports them.
- Buffer capacity: beyond 5000 messages, the oldest are discarded for good.
The View Stopped Following New Output
Symptom: New messages arrive but the list no longer scrolls to them.
Explanation: clicking a line turns Follow off on purpose, so that incoming output doesn't pull the view away while you're reading. Press End (or Follow) to resume.
UI Not Updating During Operations
Symptom: Messages don't appear until an operation completes.
Explanation: this is expected behaviour. Blender's interface can only update when the main thread is free. While another addon is blocking it, refreshes are suspended. Nothing is lost and every captured message appears as soon as the operation finishes.
Workaround: for real-time output during blocking operations, use Blender's System Console (Window › Toggle System Console on Windows), or launch Blender from a terminal on Linux and macOS. This is the one case where a terminal still helps because it keeps printing while Blender's interface is frozen. For everything else, see Running Without a Console.
Performance Issues
Symptom: Blender feels sluggish with Console Viewer enabled.
Solutions:
- Reduce Max Displayed Lines in preferences.
- Increase Update Interval (try 1.0–2.0 seconds).
- Click Clear to empty the message buffer.
- Pause capture when not actively debugging.
- Close unused Console Viewer panels.
Technical Details
Capture Architecture
Console Viewer works by intercepting Python's output streams and hooks:
sys.stdout— capturesprint()and similar output.sys.stderr— captures error output.- logging module — adds a handler to capture log records.
- warnings module — installs a
showwarninghook. sys.excepthook— captures uncaught exceptions.
The original streams are preserved, so all messages still reach the system console.
Coexisting With Other Addons
Console Viewer is not the only thing that may want Blender's output streams. When capture is switched off, the addon removes its hooks only if they are still its own. If another addon wrapped sys.stdout (or hooked sys.excepthook / warnings.showwarning) afterwards, Console Viewer leaves that addon's setup untouched and simply goes quiet instead of tearing it down.
The practical effect: enabling and disabling Console Viewer mid-session won't silence another addon's console output.
How the Display Works
The list you see is a mirror of the message buffer, kept in sync on Blender's main thread.
- Only new messages are added to the mirror on each refresh, rather than rebuilding the whole list. A full rebuild happens only after Clear or a filter change.
- Old lines are trimmed in batches, spreading the cost across refreshes instead of causing a single visible stall.
- Under an extreme flood of output, the view skips ahead to the most recent messages and inserts a marker, rather than falling permanently behind.
- The mirror lives in Blender's window data, not in your scene, so it is never written into your
.blendfile and never survives a restart, which is the correct behaviour for a session log.
Thread Safety
Console Viewer is designed for thread-safe operation:
- All buffer operations use threading locks.
- Timestamps are captured inside the lock to guarantee chronological order.
- Locks are released before UI operations, preventing deadlocks.
- Output arriving from background threads is captured safely. The display is only ever updated from the main thread.
Buffer and Display Limits
| Parameter | Value |
|---|---|
| Buffer capacity | 5000 messages (circular buffer) |
| Max message length | 10,000 characters (auto-truncated) |
| Displayed lines | Configurable, 200–5000 (default 2000) |
| Panel height | Configurable, 5–40 rows (default 12) |
| Refresh interval | Configurable, 0.1–2.0 s (default 0.15) |
Changelog
Version 2.0.0 (First public release)
Console Viewer 2.0 is the first version released to the public. Earlier 1.x versions were in house builds and were never published.
The defining change in 2.0 is real auto-scroll. The output is now drawn as a proper list widget that owns its own scrollbar and keeps the newest line in view. Earlier internal builds could only approximate this by rendering a short window of messages, or by reversing their order. Both workarounds, and both confusing to use.
- Added: True auto-scroll, with Follow / Start / End controls.
- Added: Configurable panel height (Panel Rows) and display window (Max Displayed Lines).
- Fixed: Blank rows no longer accumulate: print() produces one line, not two.
- Added: While capture is off, the panel offers a direct Open Add-on Preferences button instead of a dead-end message.
- Fixed: The message order toggle was removed. With real auto-scroll it no longer serves any purpose.
- Fixed: Turning capture off no longer destroys sys.stdout, sys.excepthook or warnings.showwarning when another addon hooked them afterwards.
- Fixed: Clear and filter changes repaint the panel immediately.
- Fixed: Corrected a case where the display limit could be exceeded under sustained heavy output.
Development history before the public release is summarised below for reference.
Version 1.5 (internal)
- Fixed: panel failing to refresh once the message buffer was full.
- Added: Cached timestamp formatting and pre-computed line wrapping per message, removing that work from every redraw.
- Added: Centralised message truncation in the buffer, covering in-place updates too.
- Fixed: Lowered the default update interval to 0.15 s for a more responsive panel.
- Added: per-thread guard to the logging handler to prevent recursive capture.
- Added: Converted the legacy addon into a Blender extension.
Version 1.4.0 (internal)
- Added: Complete thread-safe implementation with proper locking.
- Fixed: Deadlock prevention in UI redraw logic.
- Fixed: Timestamps captured inside lock for chronological order.
- Added: Configurable max display messages (100-2000).
- Added: Configurable UI update interval (0.1-2.0 seconds).
- Added: Memory leak prevention with defensive cleanup.
- Fixed: handler closure chains on reload.
Version 1.3.0 (internal)
- Added: Enhanced filtering (All, Output, Error, Info, Warning, Exception).
- Added: Tooltips for all controls.
- Fixed: Message truncation for very long messages.
- Added: Blender 4.0 minimum version requirement.
Version 1.2.0 (internal)
- Added: Python logging module capture.
- Added: Warnings module capture.
- Added: Exception hook capture.
- Added: Progress bar support (carriage return handling).
Version 1.1.0 (internal)
Version 1.0 (internal)
- Added: Initial release with core console capture functionality.
- Added: Basic message display and filtering.
- Added: Sidebar panel in Text Editor and 3D Viewport.
Contact and Support
If you encounter issues, have questions, or want to suggest features, there are two ways to reach support:
SuperHive Market
Send a private message through the SuperHive Market platform. This is the preferred method for purchase-related questions, license inquiries, or general support.
For technical support, bug reports, or feature requests:
When Reporting Bugs
Please include the following information to help diagnose issues quickly:
- Your Blender version.
- Your operating system.
- Console Viewer version.
- A description of what you were trying to do.
- What happened instead of the expected result.
- Any error messages from the panel or System Console.
- Steps to reproduce the issue.
Tip: Use Console Viewer's Copy button to export your debug output when reporting issues. This provides valuable context for troubleshooting!